I wrote two months ago about the mysterious differences in health care costs that I found so intriguing in a talk by Jonathan Skinner. (That was two months ago? Really?) Since then, the surgeon/author Atul Gawande has brought the mystery to the national stage. In a long story for the New Yorker, he gave the non-technical version of Skinner’s talk, and today he addressed some of the feedback that this article has received over the last month.
His short answer to the mystery is this:
Analysis of Medicare data by the Dartmouth Atlas project shows the difference is due to marked differences in the amount of care ordered for patients—patients in McAllen receive vastly more diagnostic tests, hospital admissions, operations, specialist visits, and home nursing care than in El Paso.
But that is not the end of the story. It only takes a sentence to explain the “proximal” cause of these cost differences, but it takes the whole article for Gawande to do justice to his theory on the underlying cause, and his is certainly not the only theory.
Since his theory of the root cause of this inequality is centered on physicians putting profit over patients, it has made some doctors uneasy. Greg Roth, a physician that I work with hadn’t had time to read the article when we last chatted, but he did attend Skinner’s talk with me two months ago. Greg told me about a detail that has emerged as doctors put Gawande’s article under their microscopes: we might be making a mountain out of molehill-sized mystery.
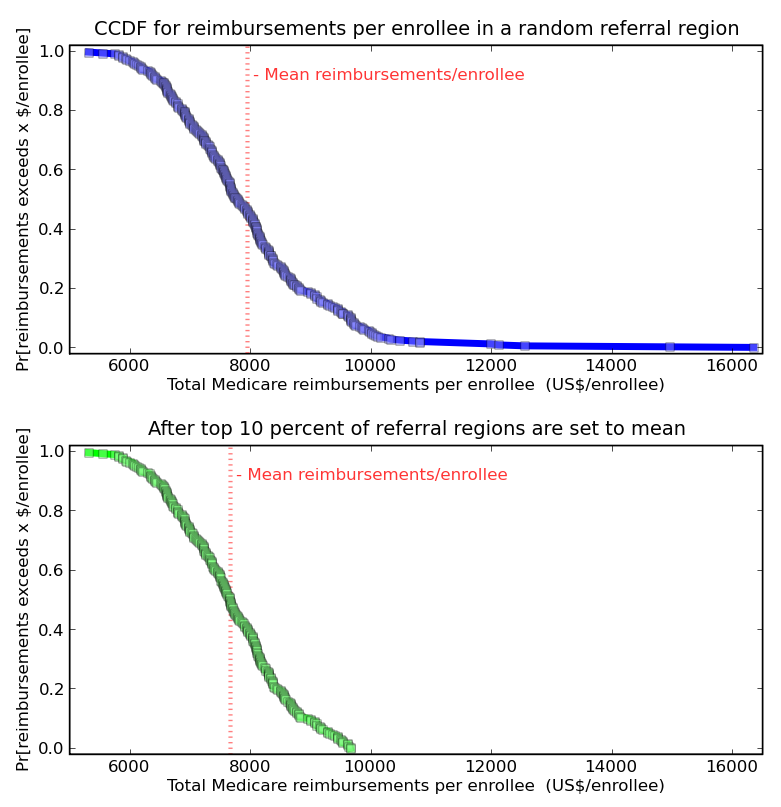
Look at this plot, which shows the complementary cumulative distribution function for the primary quantity in Gawande’s article, Total Medicare reimbursements per enrollee for 2006.

Investigative reporter have to get the story, and raking the muck way out in the tail of this distribution turned out to be a good bet this time. But McAllen is 6 standard deviations above the mean (not to imply that this distribution is normal… should it be?) How much impact would it have, for the whole population, if the outliers were greatly improved?
If through anti-fraud policing, better culture, and general hard work, the top 10% of hospitals reduced their cost per patient to the national average, that would reduce the average cost by 3.6%. Outliers show what is possible, but making a big change involves more than outliers.


 I’ve been spending the week at the Infectious Disease Modeling Summer School here at UW. It’s very interesting, and good for me to learn more about how people in my new field think (especially people in my new field, outside of my little institute…)