There are lovely libraries near my house. Three, all in different directions. I have spent hours in each, especially before my kids were in school. This is a story is about the one called the Douglass-Truth Library, the surprising way it got that name, and a computer simulation inspired by that surprise. Maybe it will surprise you, too.
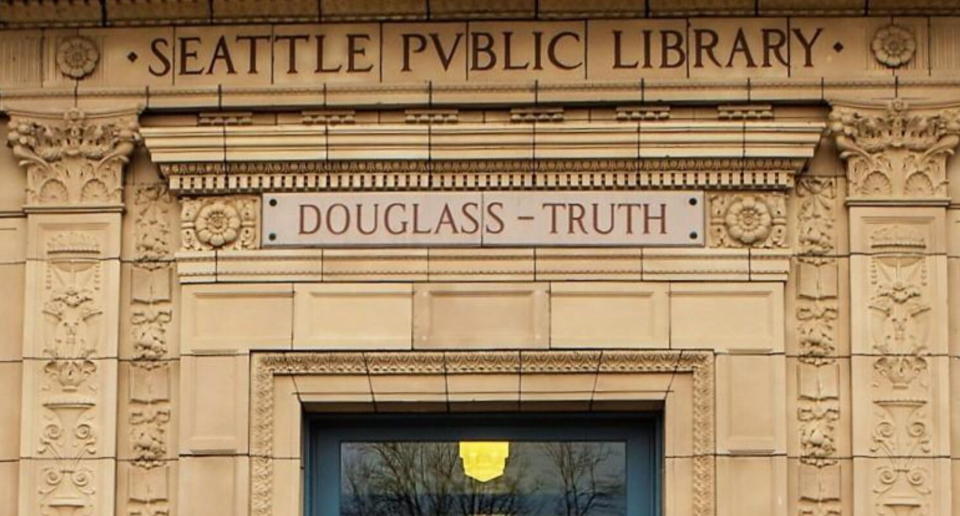
The Douglass-Truth Library. Its name stands out from its peers. They have names like “Beacon Hill Library” and “Central Library”. Most Seattle libraries are named to match their neighborhoods.
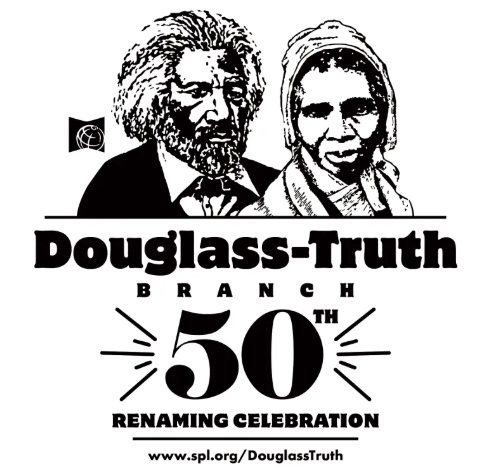
Not the Douglass-Truth Library. We just celebrated the 50th anniversary of its renaming. It was renamed in 1975 to honor the abolitionists Fredrick Douglass and Sojourner Truth. And how were these particular leaders selected for this honor? A community vote!
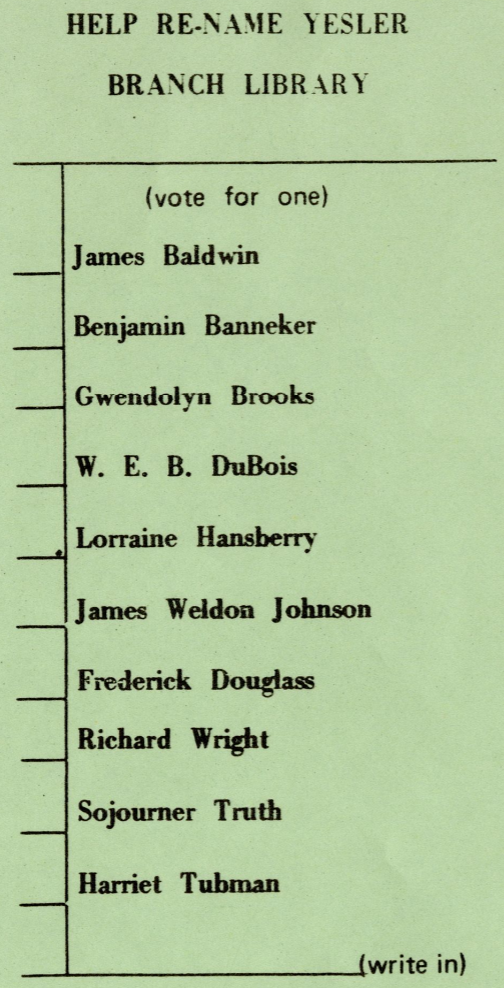
Back in the early 1970s, community leaders in a neighborhood that had become predominantly African American thought their library deserved a name that reflected the community. They organized a ballot listing ten distinguished Black Americans and invited the neighborhood to vote.
The ballot clearly says “vote for one”.
How did the library get named after two?
A tie vote! Out of a ten-person race.
That is so unlikely. Is it so unlikely? How unlikely?
When I slow down to think about it, I think it must depend on how many votes there were. One hundred voters tying does not seem likely, but it seems more likely than ten thousand voters ending in a tie. How many ballots were cast? I could not find any documentation of this. But when I was at the renaming anniversary party last December, someone remembered: around 2,000 people voted.
So now can we figure out how unlikely?
Almost. I used to love simplifying probability equations and making approximations for these sorts of formulas, and if I was writing this blog 25 years ago, it would be all about Stirling’s approximation and how with pencil and paper we could puzzle this out. Stirling showed that tie probability scales like , and that means 2,000 voters doesn’t give you 1-in-2,000 odds—it’s more like 1/45. Ties are rarer with more voters, but not vanishingly rare.
Lately, though, I’ve become more of a computer-simulation type. Pencil and paper is fine, but random number sampling is even more fun.
(Simulation code on GitHub | Direct link to run that code in Colab)
From here, I’ll give just a sketch, so you can have fun the way you like to have fun.
Assumptions: maybe the simplest way to start is if everyone is equally liked and voters are simply choosing randomly (no strategic behaviors). But would it be more likely to have a first-place tie if two front runners were each getting nearly 50% of the vote?
Simulation: With simplifying assumptions, I can simulate one person’s vote with np.random.choice(candidate_list, vote_probabilities), but it is faster to simulate everyone’s vote simultaneously. Then I need to tally the votes and see if there is a tie for first place.
def simulate_election(n_votes, candidate_probs): votes = np.random.choice(len(candidate_probs), size=n_votes, p=candidate_probs) tallies = pd.Series(votes).value_counts() return tallies.iloc[0] == tallies.iloc[1] # True if tie for first
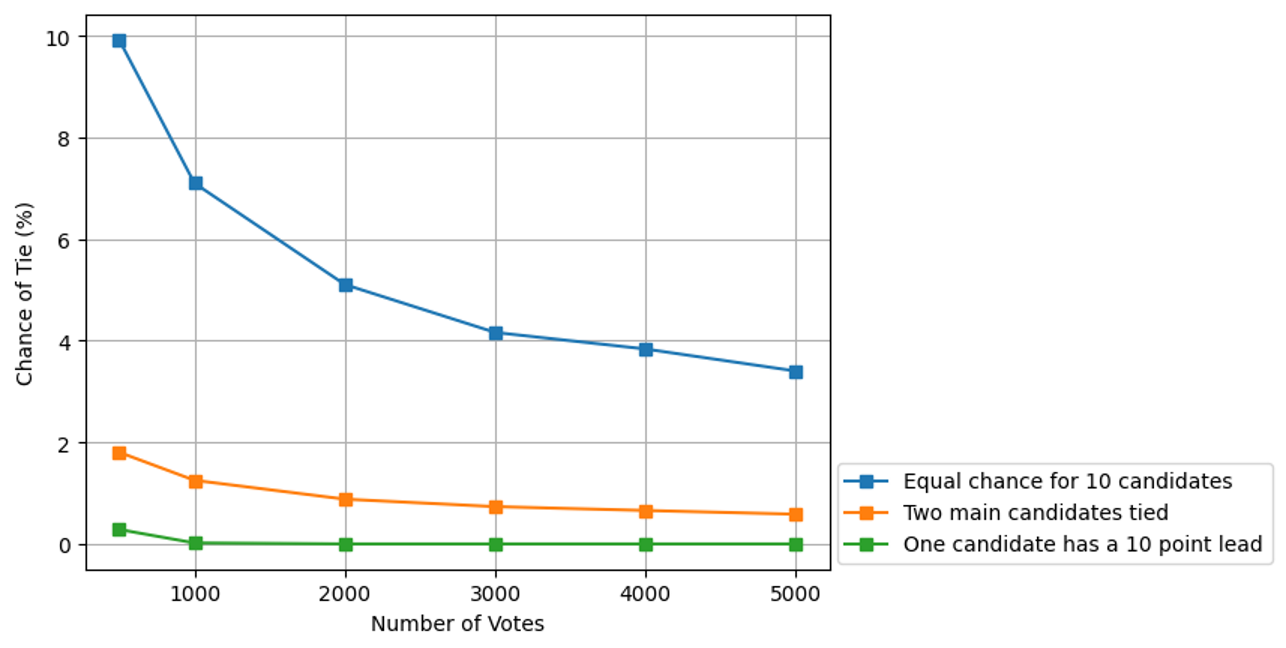
Results: If all ten candidates are equally liked, there’s roughly a 1 in 20 chance of a first-place tie (with 2,000 voters). The chances drops as turnout grows—but stays above 3% even with 5,000 voters.
If there are two front runners it is more like one in 100, and if one candidate has a comfortable majority, then a tie is extremely rare.
Conclusion: The math is fun. The computer simulation is fun. But the real breakthrough happened 50 years ago when the votes came in tied and some genius invented a new option: name the library after both heroes.