
https://plot.ly/dash/
https://community.plot.ly/c/dash
https://github.com/plotly/dash
https://plot.ly/dash/getting-started
View at Medium.com
Tag Archives: idv
One more IDV in Python approach
Comments Off on One more IDV in Python approach
Filed under Uncategorized
Its 2018, how to IDV in Python?
I’ve got a fun little viz that I need to demo for Important People (IP) in early March [editor’s note: still not done… that deadline was highly optimistic!]. How to do it?
In Python? Sure. In a Jupyter notebook? Maybe. With Matplotlib? Probably not… at least I better have a look at the state of the alternatives.
Did I mention that it is essential for this viz to be *interactive*? It needs to allow the Important People to explore the predictions of some ML model, or at least allow me to explore them while they call out how to explore.
Years ago, I attempted to designate a particular plot the “hello, world” of data viz. Remember that? I think we should extend it to a hello world of interactive data viz. Maybe just choosing the number of digits is enough. Or should it follow the visual information seeking mantra? But “hello, world” cannot be too complicated.
yhat?
Altair
https://altair-viz.github.io
https://github.com/altair-viz/altair_widgets/blob/master/examples/Iris.ipynb
http://pbpython.com/altair-intro.html
Bokeh
https://bokeh.pydata.org/en/latest/docs/gallery.html#gallery
Click to access Python_Bokeh_Cheat_Sheet.pdf
https://www.datacamp.com/courses/interactive-data-visualization-with-bokeh/
https://www.datacamp.com/community/blog/bokeh-cheat-sheet-python
https://demo.bokehplots.com/apps/movies
A Dramatic Tour through Python’s Data Visualization Landscape (including ggplot and Altair)
Comments Off on Its 2018, how to IDV in Python?
Filed under Uncategorized
Follow-up to the classroom-worthy visual analytics example
Did you have a chance to see the sum-to-fifteen game I learned about last week?
Here is an animated version of playing it:

And here is what it looks like if you arrange the numbers in just the right 2d grid:

Filed under Uncategorized
A classroom-worthy example of the power of visual analytics
I started reading an “economics of diversity” book recently, and stumbled across a great example of the power of visual analytics (included early in the book to demonstrate the value of diverse representations):
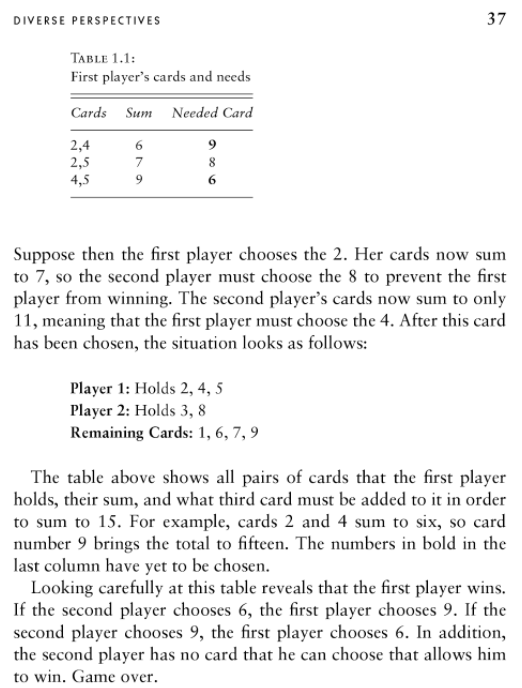
This game is hard, right? I mean I have to think about it to figure out a good move. But if you think of it visually, the right way, it is not hard. I’ll leave it as a mystery for now, and say that I can imagine a classroom exercise on this when I next teach interactive data visualization again.
Filed under Uncategorized
Visualizing Uncertainty
Click to access paper_BELIV_evaluating_uncertainty_vis.pdf
Click to access HoekstraEtAlPBR.pdf
Click to access uncertain-bus-chi2016.pdf
Click to access MacEachren_Visualizing_98.pdf
Click to access MacEachren_IEEE_TVCG_PrePub_2012_reduced_res.pdf
http://ieeexplore.ieee.org/stamp/stamp.jsp?arnumber=6654171
Click to access MacEachren_IEEE_TVCG_PrePub_2012_reduced_res.pdf
Comments Off on Visualizing Uncertainty
Filed under dataviz
New words of wisdom from S Few
The Visual Perception of Variation in Data Displays
Click to access the_visual_perception_of_variation.pdf
(well, it was new when I started this post)
Comments Off on New words of wisdom from S Few
Filed under dataviz
Javascript Things of Note
Comments Off on Javascript Things of Note
Filed under software engineering
To read: EnsembleMatrix paper
EnsembleMatrix: Interactive Visualization to Support Machine Learning with Multiple Classifiers http://research.microsoft.com/en-us/um/redmond/groups/cue/publications/CHI2009-EnsembleMatrix.pdf
I want one
Comments Off on To read: EnsembleMatrix paper
Filed under dataviz, machine learning
IDV in Python: Interactive Legend in MPLD3
We got a nice pull request for mpld3 recently, interactive legends. Another chance for me to use my new GIF animation recorder: https://github.com/jakevdp/mpld3/pull/299#issuecomment-110434953
Comments Off on IDV in Python: Interactive Legend in MPLD3
Filed under dataviz, software engineering
Unhide a toolbar in MPLD3
Did you ever want to know how to unhide the toolbar in MPLD3? Here is how: http://stackoverflow.com/questions/29976625/unhide-toolbar-in-mpld3
Comments Off on Unhide a toolbar in MPLD3
Filed under dataviz, Uncategorized
