
Mpld3 questions show up on Stack Overflow from time to time, too, and they can get really informative answers if they pull in the javascript experts. This one got a comprehensive answer that was perhaps too expert, and so this follow up was an opportunity to show off my interactive plot call-out plugin yet again.
Tag Archives: idv
IDV in Python: Retrieve Data From Dynamic mpld3 plot in python
Comments Off on IDV in Python: Retrieve Data From Dynamic mpld3 plot in python
Filed under software engineering
Digging into the GBD 2010 Risk Factors II
A follow-up on my recent adventure digging into the GBD 2010 risk factors, wherein I helped a fellow researcher find the specific diseases to which the risk factor DALYs are attributed (http://ihmeuw.org/2c6v ):

I helped find where to look at the risk factor attribution, but what if you want to download the numbers? The “download chart data as CSV” link gives you something, but it is not the risk factors, it is just the disease fractions of total DALYs:
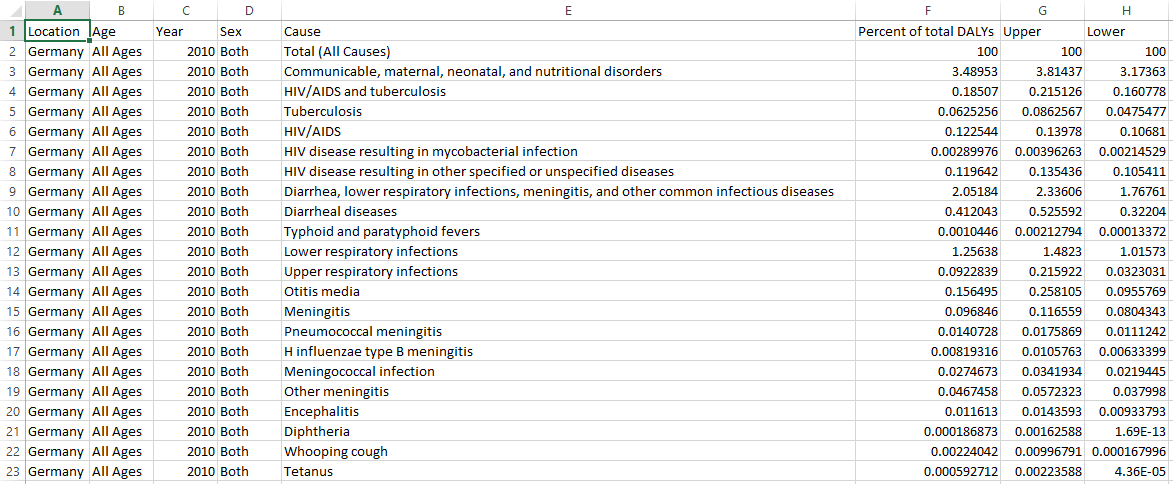
Fortunately, a javascript guru with a few minute told me the incantation to get the risk factor fractions out, recorded here for posterity:
$.fileDownload(app.settings.baseURL+'php/risk_data.php',{ httpMethod: "POST", data:{ measure: app.getMeasure(1, 'percent'), sex: app.getSex(1), age: app.getAge(1), year: app.getYear(1), location: app.getLocation(1), cause: d3.keys(app.metadata.causes), risk: app.getRisk(1), format: 'csv', title: app.charts[1].getTitle(), } });
Comments Off on Digging into the GBD 2010 Risk Factors II
Filed under global health
Anyone want to fix things in mpld3?
People are actually using mpld3. It would be great if there was more progress addressing the many issues that this use has uncovered. Interested?
Thanks for your interest in this project. I think that all of these points can be addressed, but it would be helpful to have a minimal example of python code that generates the issue in point (1) reliably. The github issue tracker has discussions related to points (3) and (4), and something that might be related to point (1). For point (2), it would be great to have a specific example in mind also, so that we can be sure any solution reduces file size substantially without compromising graphically accuracy.
- https://github.com/jakevdp/mpld3/issues/226 https://github.com/jakevdp/mpld3/issues/250
- Would be good to add an issue: https://github.com/jakevdp/mpld3/issues/new
- https://github.com/jakevdp/mpld3/issues/247
- https://github.com/jakevdp/mpld3/issues/198
As far as when all of these issues will be addressed, that is a pitfall of certain open-source projects that you might already be familiar with from your work with [related project]… I suspect that each fix will require a few hours of debugging at least, with (2) being easiest and (4) being hardest. I have a long list of issues to address, and although I’m happy to put these on it, I never seem to make progress on any of them.
Pull requests are certainly welcome, and if you or your collaborators wants to make these improvements, the mpld3 project will be happy to incorporate them into the codebase.
–Abie
Comments Off on Anyone want to fix things in mpld3?
Filed under software engineering
Digging into GBD 2010 Risk Factors
I have to make the old DisMod-III website disappear (is it still here?). It is beautiful, but it is not available, and so I have to turn away researchers who want to use it for their own work. Fortunately, I can send them to a GitHub repository of DisMod code that they can use. But recently, it was not really DisMod that the emailing researcher wanted. I think they were really interested in digging into the details behind a figure like this one:

For that, there is a non-dead website I can offer: GBD Compare. Finding your way around it can be a bit of a challenge, though, so here is a link straight to the relative contribution of each nutritional risk factor for Germany and USA: http://ihmeuw.org/2c6t ; to see from which specific diseases the risk factor DALYs are attributed, you can use a different part of this tool, linked to here: http://ihmeuw.org/2c6v
Filed under global health
IDV in Python: adding text callouts to a scatter plot interactively with mpld3
I’ve been pretty interested in the potential of interactive data visualization recently, especially ever since I saw the reaction that the Global Burden of Disease 2010 visualization tool, GBD Compare, received last year. And one promising technology for making this stuff routine is mpld3, a mashup of the Python plotting library matplotlib and the javascript visualization kernel d3. Have I mentioned this before?
The thing about interactive data visualization is that its not always clear what is useful because it excites my reptile brain, and what is useful for more logical reasons. But I was asking a colleague to add some callouts to a (non-interactive) figure recently when I realized that this is a chance for interactivity to be _obviously_ useful. These finishing touches on a graphic often take me tons of time, and using a command-line plotting program just can’t be the right way to do it. How about an mpld3 plugin that lets me add text callouts interactively? And when I’m done, it can “save” the callouts, by creating the necessary Python script to generate them again? Here it is, in a notebook.
Comments Off on IDV in Python: adding text callouts to a scatter plot interactively with mpld3
Filed under dataviz
Fact checking with GBD Compare
I’ve been developing a habit of comparing health statistics I hear in the media with the results in GBD Compare. It is nice when they agree, such as in a recent ScienceMag focus on chronic kidney disease, corroborated here: http://ihmeuw.org/1v7i . It would be even better if the cause was known, and the burden could be removed.
Comments Off on Fact checking with GBD Compare
Filed under global health
IDV in Python: Interactive heatmap with Pandas and mpld3
I’ve been having a good time following the development of the mpld3 package, and I think it has a lot of potential for making interactive data visualization part of my regular workflow instead of that special something extra. A few weeks ago, an mpld3 user showed up with an interesting challenge, and solved their own problem quite well.
I finally got a chance to look at it today, and with a little spit-and-polish this could be something really useful for me.

Comments Off on IDV in Python: Interactive heatmap with Pandas and mpld3
Filed under dataviz, software engineering
