I have just released an updated version of the SmartVA app that predicts the underlying cause of death from the results of verbal autopsy interviews (VAIs). It was a lot of hard work and I hope that people find it useful. You can find the details here: http://www.healthdata.org/verbal-autopsy/tools
There is a major challenge in using this tool (now called SmartVA-Analyze 1.1), however, which is getting the necessary data to feed into it. If you use the ODK form to collect data in just the right format, it is easy. But electronic data collection is not always possible. And there is a fair amount of data out there that has already been collected, but not yet analyzed (which is some of the motivation for creating this tool in the first place).
This blog describes the process of mapping existing VAI data into a format that can be used as input to SmartVA-Analyze 1.1. It is a challenging process that requires careful attention to detail. I will demonstrate the basics here, and I hope to provide fuller examples in multiple scripting languages as researchers complete this exercise for themselves.
A short version of the following, with example code is available on GitHub: https://github.com/aflaxman/SmartVA-Analyze-Mapping-Example
The ODK output of electronic version of the PHMRC Shortened Questionnaire is a .csv file, such as the following: https://github.com/aflaxman/SmartVA-Analyze-Mapping-Example/blob/master/example_1.csv
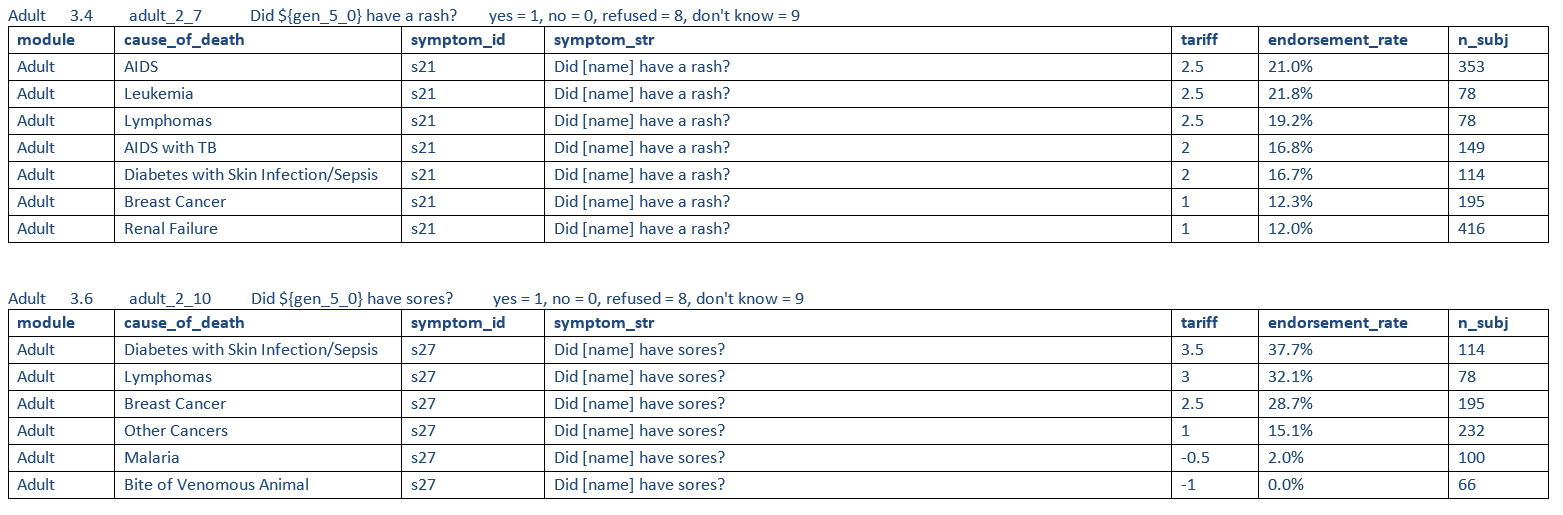
But if you have data that was collected with pencil-and-paper and then laboriously digitized, you will need to map it into that format. This Guide for data entry spreadsheet is your Rosetta Stone. SmartVA-Analyze 1.1 expects the input csv file to have a column for every row in that spreadsheet, with column heading matching the entry in the “field name” column.

I like to use Python with Pandas for doing this kind of work, but I recommend you use whatever scripting language you are most comfortable with. But I strongly recommend that you use a script to do this mapping. It will be much easier to debug and reproduce your work than if you do the mapping by hand! (I also recommend that you work incrementally and use a revision control system…) To learn more about the Python/Pandas approach, I recommend the book Python for Data Analysis.
Here is a block of Python code that will create a DataFrame with columns for every field named in the Guide:
import numpy as np, pandas as pd

# load codebook
fname = 'https://github.com/aflaxman/SmartVA-Analyze-Mapping-Example/raw/master/Guide%20for%20data%20entry.xlsx'
cb = pd.read_excel(fname, index_col=2)

df = pd.DataFrame(index=[0], columns=cb.index.unique())
(you can also see this in context in an Jupyter Notebook on GitHub here.)
SmartVA-Analyze 1.1 requires a handful of additional columns that are not in the Guide (they are created automatically by the ODK form): child_3_10, agedays, child_5_7e, child_5_6e, adult_2_9a. Here is a block of Python code that will add these columns to the DataFrame created above:
df['child_3_10'] = np.nan
df['agedays']    = np.nan # see notes though http://wp.me/pk40B-Mm
df['child_5_7e'] = np.nan
df['child_5_6e'] = np.nan
df['adult_2_9a'] = np.nan
If you save this DataFrame as a csv file, it will constitute a minimal example of what is necessary to make SmartVA-Analyze 1.1 run:
fname = 'example_1.csv'
df.to_csv(fname, index=False)
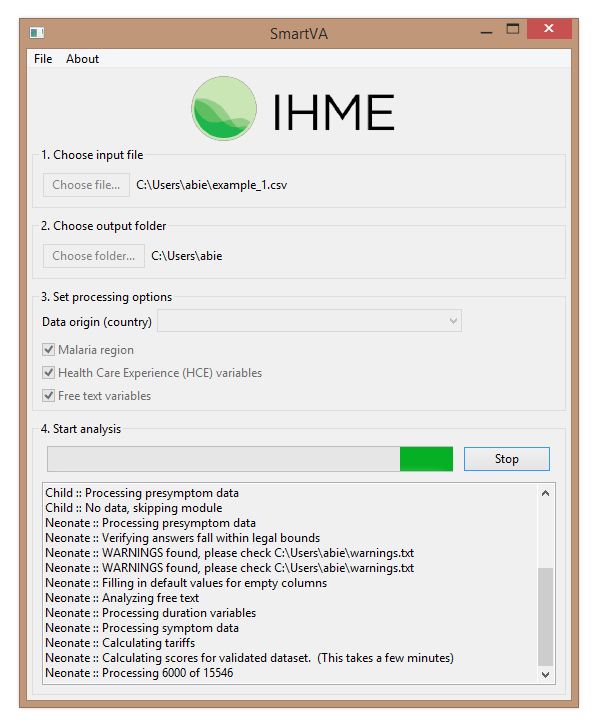
Here is what it looks like when SmartVA-Analyze 1.1 is running:

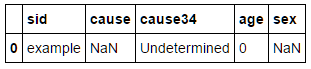
The results are rather minimal, and can be found in the “neonate-predictions.csv” file (because without an age or age group specified, this is the default):
Mapping a more substantial dataset, even a the following hypothetical example is an idiosyncratic and time-consuming procedure.
Example (hypothetical) dataset:

Python code to map the id, sex, and age:
# set id
df['sid'] = hypothetical_data.index

# set sex
df['gen_5_2'] = hypothetical_data['sex'].map({'M': '1', 'F': '2'})

# set age
df['gen_5_4'] = 1  # units are years
df['gen_5_4a'] = hypothetical_data['age'].astype(int)
This is the simple stuff… to map the injury data you will need to dig into the paper questionnaire to see how the responses are coded (the Guide spreadsheet includes some codings, but will refer you to the paper questionnaire when necessary):
# map injuries to appropriate codes
# suffered injury?
df['adult_5_1'] = hypothetical_data['injury'].map({'rti':'1', 'fall':'1', '':'0'})
# injury type
df['adult_5_2'] = hypothetical_data['injury'].map({'rti':'1', 'fall':'2'})
Mapping more columns proceeds analogously, but I recommend working incrementally, so at this point you should save the partially mapped data and make sure it runs through the SmartVA-Analyze app, and make sure that the results make some sense. For example, in this case the mapped hypothetical data from the first 2 rows are correctly identified as traffic and fall injury deaths, but the final 3 rows are undetermined (because non-injury signs and symptoms have not yet been mapped).
Mapping the additional columns proceeds analogously:
# map heart disease (to column adult_1_1i, see Guide)
df['adult_1_1i'] = hypothetical_data['heart_disease'].map({'Y':'1', 'N':'0'})

# map chest pain (to column adult_2_43, see Guide)
df['adult_2_43'] = hypothetical_data['chest_pain'].map({'Y':'1', 'N':'0', '':'9'})
I hope that this helps… if you’ve read this far, you probably have a hard job ahead of you! Please see the Jupyter Notebook version of this example here, and good luck!