
I have recently started helping out with some computer modeling efforts to support outbreak response, and I’m learning that there are a lot of projects already underway. To learn from others, and also to perhaps be helpful to people who I don’t know who are also working on this, I’m posting this write-up of an estimate I just produced: estimates of the number of people in nursing homes by age-group and facility.
As you may know, many of the deaths so far in the COVID-19 outbreak have been among people who were in nursing homes (28 out of 37, as of March 3, 2020). How many people are in nursing homes? And, since age seems to be an important determinant of disease severity, how old are they? I used open sources to make estimates for all nursing facilities in Washington State. If this is useful to you, great! And if you know how to do this better, please let me know!
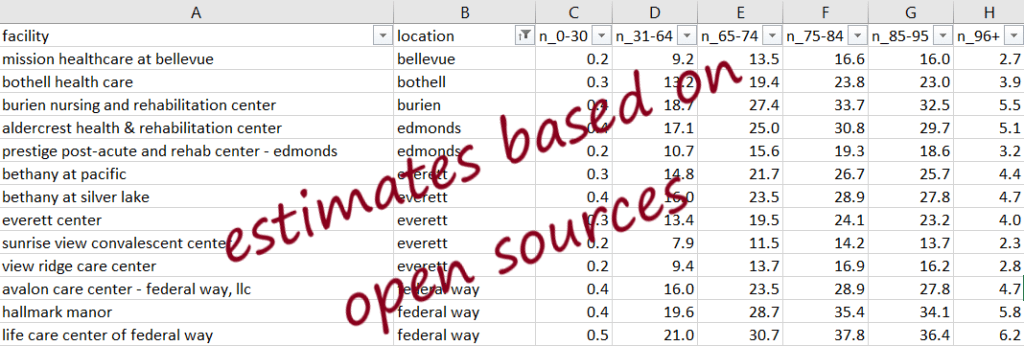
Here is a csv file you can use if you are doing disease modeling. I’ve put a Jupyter Notebook with all the code to derive these estimates on the web, and below I have collected some details on the potential data sources that this and other future estimates might use.
Medicare Minimum Data Set (MDS) 3.0
Medicare collects quality improvement data regularly from all skilled nursing facilities, and publishes summaries from this “Minimum Data Set (MDS) 3.0” exercise. You can find some information about it online: https://www.cms.gov/Research-Statistics-Data-and-Systems/Computer-Data-and-Systems/Minimum-Data-Set-3-0-Public-Reports/Minimum-Data-Set-3-0-Frequency-Report
MDS provides data in 10-year age groups, but the data on the web gives only state-level values:
| State | 0-30 | 31-64 | 65-74 | 75-84 | 85-95 | > 95 | State Total |
| Alabama | 0.80% | 17.31% | 21.98% | 28.87% | 27.16% | 3.88% | 23416 |
| … | |||||||
| Washington | 0.36% | 15.82% | 23.15% | 28.52% | 27.47% | 4.68% | 16323 |
| West Virginia | 0.18% | 15.25% | 20.43% | 29.77% | 30.16% | 4.21% | 9624 |
| Wisconsin | 0.23% | 10.93% | 18.18% | 27.66% | 36.02% | 6.98% | 22206 |
| Wyoming | 0.13% | 10.20% | 17.62% | 29.22% | 36.31% | 6.53% | 2344 |
| NATIONAL TOTAL | 0.53% | 16.26% | 20.39% | 27.54% | 30.18% | 5.10% | 1369853 |
Can we get more detail? This url (https://www.resdac.org/cms-data/files/mds-3.0) seems like it would have the full data file somewhere, but I was not able to locate it.
Decennial Census Summary File One (SF1)
There is also data with fine geographic precision available from the decennial census. The “Summary File One (SF1)” includes tables on the number of people living in skilled nursing facilities in each census block. This is available at the county and MSA level, stratified by sex and 5-year age groups (top coded at 85+), but it is now 10 years out of date, so perhaps it is not that useful. https://factfinder.census.gov/faces/tableservices/jsf/pages/productview.xhtml?pid=DEC_10_SF1_PCO5&prodType=table
| SF1 PCO5 fractions in King County Nursing Homes (2010) | ||
| 0-29 | 403 | 6.7% |
| 30-64 | 862 | 14.3% |
| 65-74 | 685 | 11.4% |
| 75-84 | 1442 | 24.0% |
| 85+ | 2621 | 43.6% |
| Total | 6013 | 100.0% |
It does have the sex ratio, maybe that is useful. MDS must have that, too, though. It is also available at the census block level, stratified by sex and broad age groups (<18, 22-64, 69+, if I’m reading it correctly).
Washington Aging and Long-Term Support Administration (ALTSA)
https://www.dshs.wa.gov/altsa/management-services-division/nursing-facility-rates-and-reports
This state agency maintains a list of nursing homes in Washington State, and has bed counts for each nursing home. It does not provide an age breakdown, though. It puts WA State capacity at 19,332 beds.
ALTSA and MDS together show WA State is using 84% of available beds in nursing homes.
Model
It seems a bit grandiose to call this a statistical model, although I think it is technically accurate to say that I have used a “first-order log-linear model” to estimate the number of individuals in nursing homes by facility and by age group. The formula is the following, where N(age, facility) is the number of individuals in a given age group and a given facility:
N(age, facility) = total number * age share * facility share
Conclusion
For convenience, here is a link to the csv file that I produced with this approach, and here is a link to the Jupyter Notebook with all the code to derive these estimates from open sources. If you know how to make estimates like this that are more accurate, please let me know!

Are there ways in which you think a computer science grad student without background in epidemiology or public health can be of help with understanding, or understanding how to manage, this pandemic?