
Lots of new features: http://vizhub.healthdata.org/gbd-compare/ Very smooth UX. Do old links still work?
Category Archives: dataviz
Major Updates to GBD Compare tool
Comments Off on Major Updates to GBD Compare tool
Filed under dataviz, global health
I asked for an improvement to mpld3, and somebody did it!
So cool! http://nbviewer.ipython.org/gist/aflaxman/153dc591c6b63578d9ec
If you don’t ask, how would somebody know that you want it:
https://github.com/jakevdp/mpld3/issues/312
Comments Off on I asked for an improvement to mpld3, and somebody did it!
Filed under dataviz, software engineering
IDV in Python: Interactive Legend in MPLD3
We got a nice pull request for mpld3 recently, interactive legends. Another chance for me to use my new GIF animation recorder: https://github.com/jakevdp/mpld3/pull/299#issuecomment-110434953
Comments Off on IDV in Python: Interactive Legend in MPLD3
Filed under dataviz, software engineering
Unhide a toolbar in MPLD3
Did you ever want to know how to unhide the toolbar in MPLD3? Here is how: http://stackoverflow.com/questions/29976625/unhide-toolbar-in-mpld3
Comments Off on Unhide a toolbar in MPLD3
Filed under dataviz, Uncategorized
How did I end up reading a 30 year old book on density estimation?
Simple, I wanted to make violin plots for efficiency scores, and they shouldn’t have any density below zero. Here is a sneaky way to sneak such a figure out of Python/Seaborn: https://github.com/mwaskom/seaborn/issues/525#issuecomment-97651992

The truncation makes them look more like gyro meat than violins.
Comments Off on How did I end up reading a 30 year old book on density estimation?
Filed under dataviz
Tables of Stacked Bars in mpl (but not mpld3)
Here is a little feature in Matplotlib that I never saw before: stacked bar plots with tables attached. Perhaps too ugly for my Iraq Mortality stacked bar charts, but definitely handy for exploratory work.
I learned about it because it doesn’t work in `mpld3`… just one more benefit of being part of an open-source project. It would be so cool to have a `mpld3` version with some interactivity included, since interactivity can address one pitfalls of the stacked bar chart, the challenge of comparing lengths with different baselines.
Comments Off on Tables of Stacked Bars in mpl (but not mpld3)
Filed under dataviz
Pretty bug in mpld3
It’s not quite d3-broke-and-made-art quality, but I like the plot in this bug report: https://github.com/jakevdp/mpld3/issues/274#issuecomment-68576519
Comments Off on Pretty bug in mpld3
Filed under dataviz, software engineering
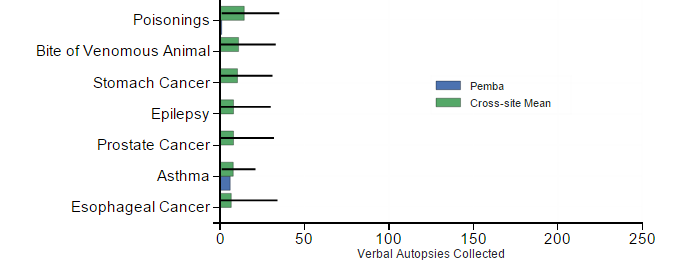
Interactive Horizontal Bar Charts
Some notes on them here: http://nbviewer.ipython.org/gist/aflaxman/c93489dd19cee2eabf00
Comments Off on Interactive Horizontal Bar Charts
Filed under dataviz, software engineering
Introducing Smudge
I had an inspiration to make something a couple weeks ago for #MakeSomethingDay (the productive alternative to #BuyNothingDay). It is a finger-painting app that neighborhood kids have been enjoying. http://bl.ocks.org/aflaxman/a31763011f9da46fc6d2

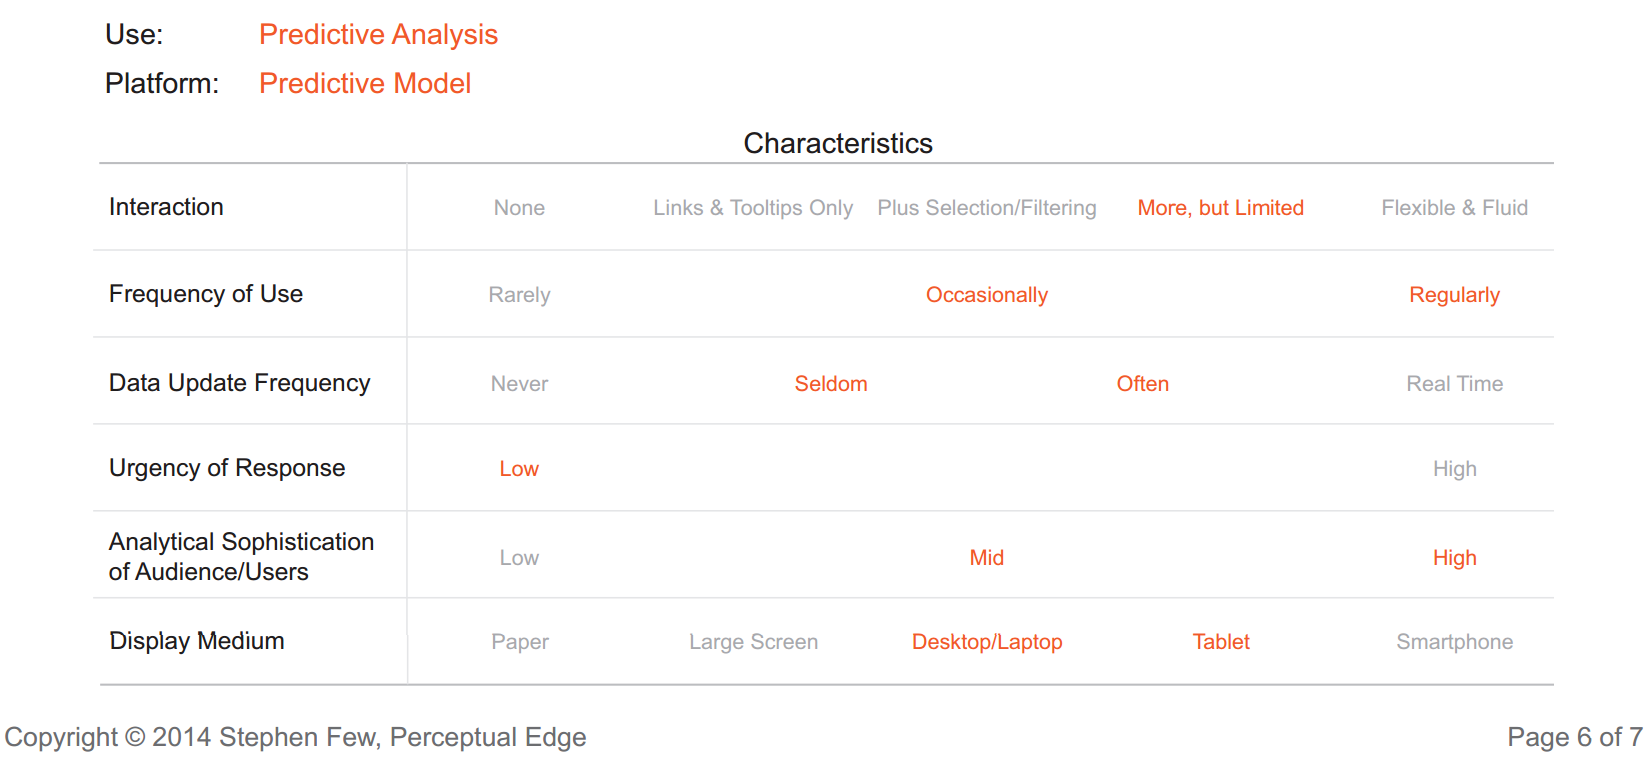
Stephen Few on Display Platforms
A new issue of Stephen Few’s Visual Business Intelligence Newsletter is out. I love categorizing things like this. I have been thinking of interaction very differently than he has, but everything else seems sensible to me.
Comments Off on Stephen Few on Display Platforms
Filed under dataviz
