Gene Balk might be the highest profile user of Census data in Seattle. He is a columnist for the Seattle Times, and as the “FYI Guy”, his columns center on facts in figures. Will the Census Bureau’s dedication to differential privacy ruin his work?
Let’s investigate. His July 17th column was titled “For first time this decade, a dip in King County’s white population, census data shows”. As you might suspect from the title, it turns entirely on census data, specifically the recently published 2018 Annual Population Estimates, which include estimates of the racial composition of the United States, each state and county, by year. In the column, Gene focused on how the race-specific population numbers changed from 2017 to 2018:

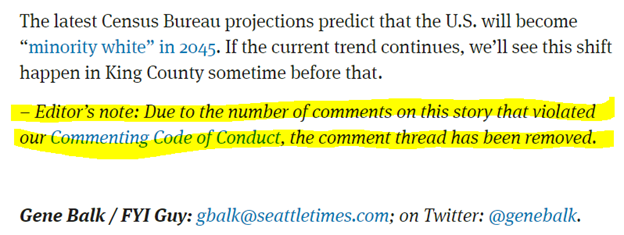
A provocative topic, for sure. I read recently that demographers avoid drawing attention to the national version of this issue. I would have thought that perhaps it would not be as controversial in a liberal city like Seattle. Perhaps I would have been wrong, as demonstrated by the editor’s note on the Seattle Times column:
To differential privacy
If I have understood correctly, there is not currently differential privacy in the disclosure avoidance system for Population Estimates. But what if there was? That would likely mean that the reported values would be noisy versions of the version now available on the Census website. Instead of saying that there were an estimated 744,955 people living in Seattle on July 1, 2018, it might say that there were 744,955 + X – Y, where X and Y are numbers drawn randomly from a geometric distribution. (It might be a bit more complicated than that, but I don’t think too much more complicated.) There is a crucial and yet-to-be-made decision about the appropriate standard deviation of this distribution, often described as the “privacy loss budget”, and also known as epsilon.
The privacy loss epsilon that people have been talking about for the decennial census is 0.25, which I recently learned is just for testing purposes.
Let’s reproduce the key figure with an epsilon of noise added. I started by trying epsilon of 0.01, since that sounds very private to me. I’m not being very precise here, but I am following some code from the Census Bureau’s End-to-End test.

For the purposes of having something that visibly changes, let’s also try a reduced epsilon of 0.001, which sounds too small, to me. Is this a useful way to investigate how DP might change things? It looks like even at this level of privacy loss, in 99 out of 100 noisy versions the story is the same: a dip in White population of King County.
At least in this case, DP will not change the story for the FYI guy!
(Notebook to reproduce these figure here.)