
To take my mind off my meetings, I spent a little time modifying the Spatial Preferred Attachment model from Aiello, Bonato, Cooper, Janssen, and Prałat’s paper A Spatial Web Graph Model with Local Influence Regions so that it changes over time. Continue reading
Random Graphs in NetworkX: My Spatial-Temporal Preferred Attachment Diversion
Filed under combinatorics, probability
Network Theory in Health Metrics
The heavy-tailed/small-worlds crowd had a big impact in health research recently, and now it’s drawing criticism from the theorists. Slate covered the story well a couple weeks ago, and interviewed Russ Lyons at length about the methodological shortcomings of the evidence that obesity, smoking, and loneliness are socially contagious. The Slate article even links to Russ’s preprint on the matter, which is some pretty technical stuff to point a general audience towards. Go Slate!
When I passed on some of Russ’s concerns to my experienced health metrics colleagues, one replied that the idea of social contagion is important enough that it doesn’t matter if the methods are wrong. Interesting perspective. It reminds me of Gian Carlo Rota’s ordering of mathematical results: most important are definitions, less important that that are theorems, and much, much less important than that are the proofs.
I’ve been in meetings for almost 3 weeks now, and meanwhile more good papers on networks for health are pouring out. Christakis and Fowler have posted a preprint to arxiv, showing how network thinking improved flu surveillance of Harvard undergrads. So maybe the idea was the important part. Meanwhile, the Cosma Shalizi and Andrew Thomas have an additional critique preprint, to be put in the same category as Russ’s. I asked Russ what he would accept as evidence of social contagion, and I didn’t find out, but the paper by Shalizi and Thomas says maybe nothing can be convincing: Homophily and Contagion Are Generically Confounded in Observational Social Network Studies.
For me, it’s time to get back to that meeting!
Filed under global health, statistics
Congratulate Me
I’ve got good news to announce, I’m going to be an assistant professor of medicine at UW starting in July. I definitely would not have thought I’d one day be in the school of medicine when I started my graduate studies in Algorithms, Combinatorics, and Optimization, but I love global health research, and this is a good place to sit if I’m going to keep doing it. You’ll still find me here at the Institute for Health Metrics and Evaluation, but soon I’ll get to move offices.
Filed under global health
Teleportation Measurements
I’m not attending WWW this week, but I am promoting a paper that I helped with, Tracking the random surfer: Empirically measured teleportation parameters in PageRank. My main contribution was connecting the people with the idea to the people with the data, but I’m happy with the results.
Incidentally, this sort of measurement has a great application in health metrics. But I’m going to keep it secret for a little while, to get my thoughts in order.
Comments Off on Teleportation Measurements
Filed under statistics
Practical MCMC Advice: When to Stop
I read some good practical advice about when enough is enough in Markov Chain Monte Carlo sampling this morning. In their “Inference from simulations and monitoring convergence” chapter of Handbook of Markov Chain Monte Carlo, Andrew Gelman and Kenneth Shirley say many useful things in a quickly digested format. Continue reading
Comments Off on Practical MCMC Advice: When to Stop
Filed under MCMC, statistics, TCS
Verbal Autopsy Challenge from AI-D
I was down in Palo Alto last week to attend the AAAI session on Artificial Intelligence for Development. The proceedings should be available online soon.
I was there to connect with other theoretical computer science and find out how they have been applying machine learning to “development”. It turned out that development means mostly applications to health, education, and agriculture in this crowd.
I was also there to share a very concrete challenge problem that I’ve been dabbling in here at IHME, which my colleague Sean Green presented our short paper on: the Verbal Autopsy.
Instead of recapping the problem in detail here, I’ll point you to our paper, and try to say just enough to get you interested. Continue reading
Filed under global health
A useful metaphor for explaining MCMC
I work in an interdisciplinary institute, and you should see the fun when mathematicians, statisticians, and physicists try to discuss models and methods for health metrics each using the dialect of their specific fields. And then throw doctors and epidemiologists into the mix, with the understanding that doctors secretly think scientists might not be smart enough to be doctors and vice-versa.
It’s here where I think this metaphor my officemate and I were just trying out will be really useful. Markov Chain Monte Carlo (MCMC) is this foundational technique in my work lately, the central algorithm I have been using for sampling from the posterior distribution of all of my models. But “how does it work?”, my non-MCMC colleagues sometimes dare to ask me. (Or more frequently lately, “why doesn’t it work?”)
To explain by way of analogy, imagine that the posterior probability density of the model is a mountain, with higher probability parameters corresponding to points of higher elevation. Our goal is to summarize the topography of the mountain. Many of my colleagues are familiar with “hill-climbing algorithms”, wherein the algorithm looks for the mountain peak by taking the steepest path up from wherever it currently stands. (Familiar because they have using algorithms that do this, and often, since this is the pacific northwest, because they spend their weekends doing this themselves on actual mountains.)
MCMC is an approach that explores the mountain with a “drunken walk”, one carefully designed to stand at points of a given elevation for an amount of time proportional to the elevation. I love the visual, drunken mountain climbing.
Then, as Nate and I were just discussing, the “why do/doesn’t it work” question has an analogical answer summarized by these pictures:


Which mountain are you trying to climb drunk?
Inequality vs Stuff
I went to a talk a few weeks ago by Richard Wilkinson and Kate Pickett, global health researchers who have written a book called The Spirit Level. They were quick to explain that, while the name makes perfect sense in British English, it has been a source of continuing confusion in American English. What is a “spirit level”? It’s a building tool, a type of ruler with little bubbles in it to show when it is parallel to the ground. Maybe it’s called a carpenter level in the states, or just a level when the context is clear.
I would have called it “Inequality vs Stuff”, or at least that’s my description of the talk: a vast array of scatterplots showing the relationship between income inequality and different measurements of population health. Here is one that is typical for their case:

When they told the story, they started with a composite health index scattered against inequality, since that has much less noise, and then use the noisy plots like this one as supporting evidence when they show that the relationship holds for everything.
The slide that stuck with me the most is one that diverged from their story a little:

Not population health this time, but still interesting. Something to share with your entrepreneur friends.
These plots seem like enough fun that I made my own, based on a question from the question and answer portion of the talk. I’ve forgotten who, but someone in the audience asked “How is inequality related to total fertility rate?” and the answer from Wilkinson and Pickett was along the lines of “We never thought to check, how do you think it might be related?”
Since I had the data lying around from my attempts to learn about model selection last summer, I made myself the plot. Turns out there is not much of an association.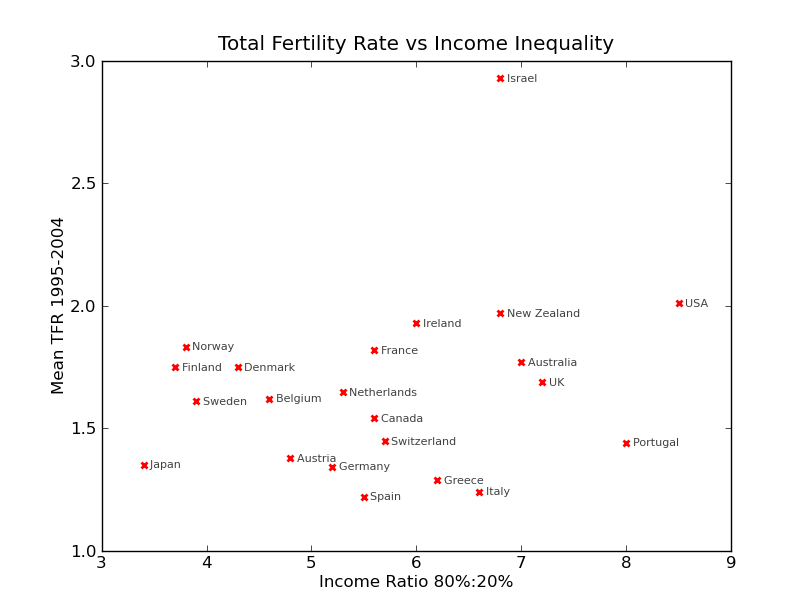 The only example of a non-association the speakers mentioned was a surprise to them: suicide rates are not correlated with income inequality.
Filed under global health, Mysteries
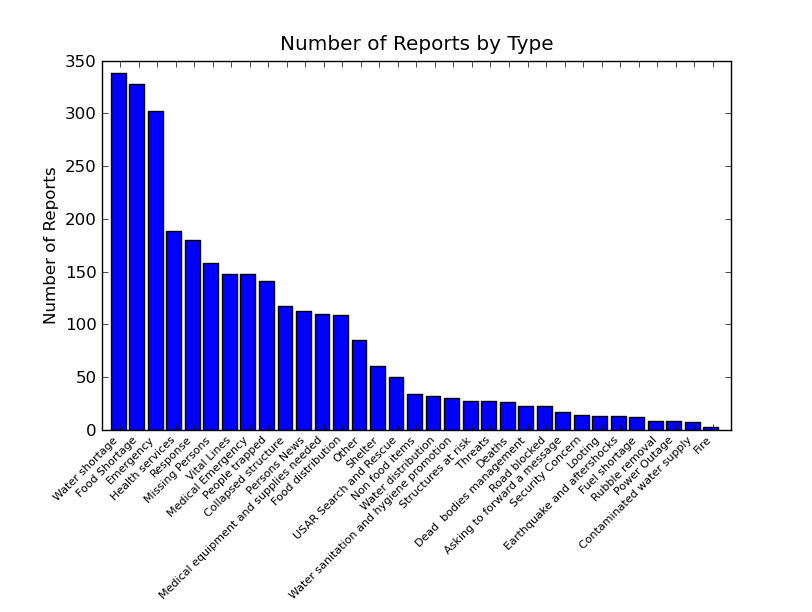
haiti.ushihidi by category
What people are saying now: Water shortage, food shortage, medical equiptment needed. What they are not saying as much anymore: Food, shelter, search and rescue.
 (data details in previous post.)
Filed under combinatorial optimization, global health
OR and Crisis Camp
When the earthquake devastated Haiti, Laura McLay asked if OR is helping with the relief efforts. I’ve been wondering the same thing, and I went to a “Crisis Camp” this weekend to see if there is anywhere I could plug in.
This Crisis Camp business is hard to describe, and I didn’t really know what I was getting into when I showed up, and it seems like most of the other participants didn’t either. But we all woke up for a 9 AM meeting on Saturday, and we all wanted to do something good for the people of Haiti.
This isn’t exactly something you can make an impact on in a day, and the only tangible result of my work was fixing a typo on a wiki, but I did learn a little bit about what is going on. One group of geographers did a quick course on Open Street Maps and was able to start helping in an effort to update the maps of Port-au-Prince, tagging blocked roads, collapsed buildings, etc.
I joined group that connected with an ongoing project to find hospitals outside Port-au-Prince and help them share information about available capacity with people who need medical attention. Like I said, I didn’t manage to help with this in a day, but I did learn about this Sahana project and their success in finding the lat and long of 100 hospitals in Haiti.
Another impressive data sharing tool that I a look at is Ushahidi, which I had heard about before, but never seen in action. This is a project that has a free SMS gateway for people in Haiti to use to report emergencies or share information. They translate messages into english and post them on the web with a CC-BY-SA license. I started looking at them yesterday, and they can be heartwrenching. Here is the breakdown by category, as of last night:
Does this inspire any operations research solutions? It makes me think of vehicle routing, if the earthquake damage tags in Open Street Maps show which roads are closed, that is:

I’m not sure if they do. (Red is map features with the tag earthquake:damage, but those are mostly IDP camps.)
Filed under combinatorial optimization, global health
