
I don’t feel like having that post about how big things are brewing in US health care reform on the top of my blog anymore, so here is a quick replacement: a ranking paper that caught my eye recently on arxiv, where computer scientists is applied to politics: On Ranking Senators By Their Votes, by my fellow CMU alum, Mugizi Rwebangira (@rweba on twitter).
Holiday reading
Whoops, I got busy again and didn’t have time to make new pictures of TFR vs HDI for Rif and Tanja, let alone fix the Bayes factor estimation code or implement the nested sampling version (which I think will be the cool way to estimate evidence). But coming soon: How MCMC is tying my new work in Health Metrics to my education in Operations Research. That will be in two weeks, at best.
Until then, here is some light reading to get ready for a big week of US healthcare reform debate: Get Sick, Get Out, a survey conducted by lawyers interested in catastrophic medical payments and their connection to housing forclosures. It’s 40 pages long, but it’s in legal-journal format, where they have like 10 words per page if you skip the footnotes. From the abstract:
Half of all respondents (49%) indicated that their foreclosure was caused in part by a medical problem, including illness or injuries (32%), unmanageable medical bills (23%), lost work due to a medical problem (27%), or caring for sick family members (14%).
I’m excited for the next week of healthcare reform debates. When my most jaded friends are forwarding me Moveon.org videos (and I’m listening to 4 minutes of recent REM), I know something unusual is going on.
Happy labor day weekend!
Comments Off on Holiday reading
Filed under global health, videos
MCMC in Python: PyMC for Bayesian Model Selection
(Updated 9/2/2009, but still unfinished; see other’s work on this that I’ve collected)
I never took a statistics class, so I only know the kind of statistics you learn on the street. But now that I’m in global health research, I’ve been doing a lot of on-the-job learning. This post is about something I’ve been reading about recently, how to decide if a simple statistical model is sufficient or if the data demands a more complicated one. To keep the matter concrete (and controversial) I’ll focus on a claim from a recent paper in Nature that my colleague, Haidong Wang, choose for our IHME journal club last week: Advances in development reverse fertility declines. The title of this short letter boldly claims a causal link between total fertility rate (an instantaneous measure of how many babies a population is making) and the human development index (a composite measure of how “developed” a country is, on a scale of 0 to 1). Exhibit A in their case is the following figure:

An astute observer of this chart might ask, “what’s up with the scales on those axes?” But this post is not about the visual display of quantitative information. It is about deciding if the data has a piecewise linear relationship that Myrskyla et al claim, and doing it in a Bayesian framework with Python and PyMC. But let’s start with a figure where the axes have a familiar linear scale! Continue reading
Filed under MCMC, statistics
August is Too-Many-Projects Month
(Tap… tap… tap… is this thing on? Good.)
July was vacation month, where I went on a glorious bike tour of the Oregon/California coast, and learned definitively that I don’t like biking on the side of a highway all day. Don’t worry, I escaped in Coos Bay and took trains and buses between Eugene, Santa Cruz, Berkeley, and SF for a vacation more my speed.
But now that I’m back, August is turning out to be project month. I have 3 great TCS applications to global health in the pipeline, and I have big plans to tell you about them soon. But one mixed blessing about these applications is that people actually want to see the results, like, yesterday! So first I have to deal with the results, and then I can write papers and blogs about the techniques.
Since Project Month is a little over-booked with projects, I’m going to have to triage one today. You’ve heard of the NetFlix Challenge, right? Well, github.com is running a smaller scale recommendation contest, and I was messing around with personal page rank, which seems like a fine approach for recommending code repositories to hackers. I haven’t got it working very well (best results, 15% of holdout set recovered), but I was having fun with it. Maybe someone else will take it up, let me know if you get it to work; networkx + data = good times.
    f = open('download/data.txt')
    for l in f:
        u_id, r_id = l.strip().split(':')
        G.add_edge(user(u_id), repo(r_id))
Filed under combinatorial optimization, software engineering, TCS
ID Modeling Summer School
 I’ve been spending the week at the Infectious Disease Modeling Summer School here at UW. It’s very interesting, and good for me to learn more about how people in my new field think (especially people in my new field, outside of my little institute…)
I’ve discovered a pet peeve during this week of presentations, though. I’ve seen a lot of numerical examples where the numbers work out perfectly… a little too perfectly. If you split 1000 people into an experimental and control group by choosing a random subset of 500, fine. But if you look within that group to see how many have a trait that occurs independently with probability 0.2, you do not often find exactly 100 in group A and 100 in group B. I think a little more complexity in the numbers makes the example easier to understand.
I’m sure that you, my loyal reader, can generate random numbers from a multitude of distributions, if you wanted to spend the time. But if you’re busy, busy, busy, then you can have wolfram alpha do all the work. It actually comes through for that one: “sample Binomial(500, .2)“.
Filed under education, global health
US Health Care Costs, cont.
I wrote two months ago about the mysterious differences in health care costs that I found so intriguing in a talk by Jonathan Skinner. (That was two months ago? Really?) Since then, the surgeon/author Atul Gawande has brought the mystery to the national stage. In a long story for the New Yorker, he gave the non-technical version of Skinner’s talk, and today he addressed some of the feedback that this article has received over the last month.
His short answer to the mystery is this:
Analysis of Medicare data by the Dartmouth Atlas project shows the difference is due to marked differences in the amount of care ordered for patients—patients in McAllen receive vastly more diagnostic tests, hospital admissions, operations, specialist visits, and home nursing care than in El Paso.
But that is not the end of the story. It only takes a sentence to explain the “proximal” cause of these cost differences, but it takes the whole article for Gawande to do justice to his theory on the underlying cause, and his is certainly not the only theory.
Since his theory of the root cause of this inequality is centered on physicians putting profit over patients, it has made some doctors uneasy. Greg Roth, a physician that I work with hadn’t had time to read the article when we last chatted, but he did attend Skinner’s talk with me two months ago. Greg told me about a detail that has emerged as doctors put Gawande’s article under their microscopes: we might be making a mountain out of molehill-sized mystery.
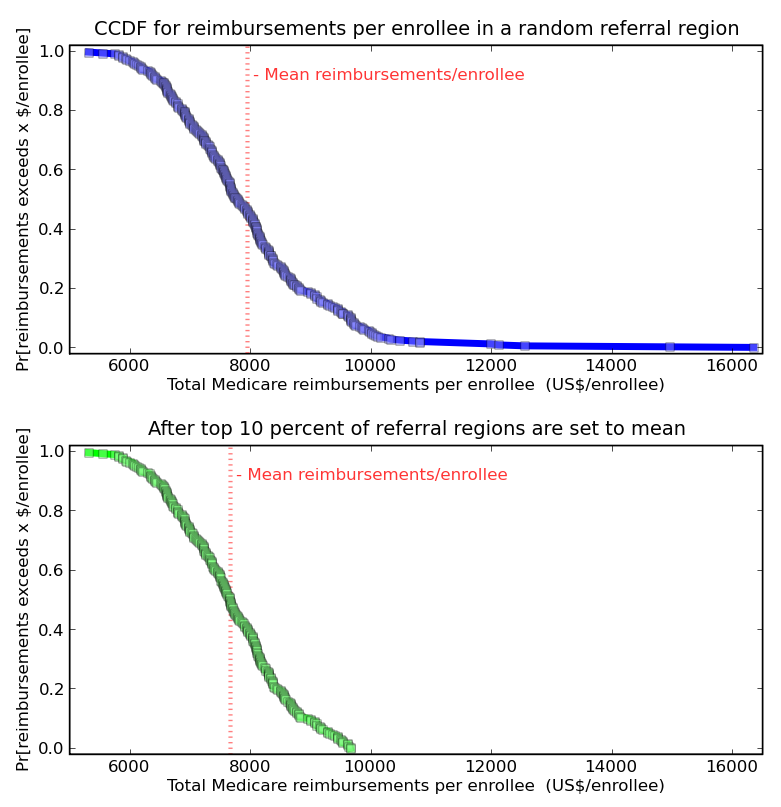
Look at this plot, which shows the complementary cumulative distribution function for the primary quantity in Gawande’s article, Total Medicare reimbursements per enrollee for 2006.

Investigative reporter have to get the story, and raking the muck way out in the tail of this distribution turned out to be a good bet this time. But McAllen is 6 standard deviations above the mean (not to imply that this distribution is normal… should it be?) How much impact would it have, for the whole population, if the outliers were greatly improved?
If through anti-fraud policing, better culture, and general hard work, the top 10% of hospitals reduced their cost per patient to the national average, that would reduce the average cost by 3.6%. Outliers show what is possible, but making a big change involves more than outliers.
Filed under global health, Mysteries
Population Health in Iran
The political situation in Iran has been in the news and on the nets a lot this week. I hope that the friends and families of all my Iranian colleagues are safe. I’m thinking of you.

Comments Off on Population Health in Iran
Filed under global health
Anatomy of a Django-driven Data Server
I haven’t had time to write anything this week because I am up to my neck in this Seven-Samurai-style software engineering project. You know, where a bunch of untrained villagers (that’s me) need to defend themselves against marauding bandits (that’s the Global Burden of Disease 2005 Study), so they have to learn everything about being a samurai (that’s writing an actual application that people other than this one villager can use) as quickly as possible.
 I guess this analogy is stretching so thin that you could chop it with Toshirō Mifune’s wooden sword. But, if anyone knows how a mild-mannered theoretical computer scientist can get a web-app built in two weeks, holler. If you prefer to explain in terms of wild-west gunslingers, that is fine.
Here’s my game plan so far: I’m going to make the lightest of light-weight Python/Django apps to hold all the Global Disease Data, and then try to get my epidemologist doctors to interact with it on the command-line via an interactive python session.
The rest of this post is basically a repeat of the Django tutorial, but specialized for building a data server for global population data. As far as interesting theoretical math stuff, hidden somewhere towards the end, I’ll do some interpolation with PyMC’s Gaussian Processes using the exotic (to me) Matérn covariance function. Continue reading
Filed under global health, software engineering
Women in Science Booklet from L’Oréal, UNESCO, AAAS
 AAAS Science Careers has a nicely put-together booklet about some star women in science. Maybe you have a young friend or relative who would like a copy.
Comments Off on Women in Science Booklet from L’Oréal, UNESCO, AAAS
Filed under education
Computers and the Flu
 I was reluctant to enter this media frenzy about H1N1 flu (or whatever we end up calling it…), but only 8% of telephone respondents are “not concerned at all” about these events, so I thought I’d say something more than nothing.
Information technology’s main contribution so far has been the rapid spread of misinformation: for example, eating pork is no less safe than usual, despite rumors to the contrary twittering around the globe.
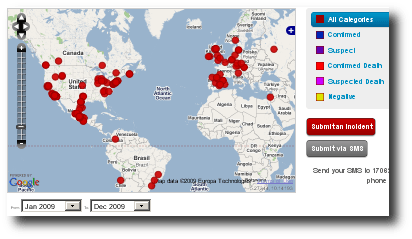
But there is an opportunity for IT to shine a little bit, too. I’m optimistic about Ushihidi’s web2.0 approach to “crowdsourcing crisis information”. Definitely something I can spend too much time looking at.
Filed under global health
