
Here is a new book on Bayesian stats that Kyle forwarded on to me: Principles of Uncertainty. Chapter 11 looks unique, on “multiparty problems”, and a pdf of the whole thing is available from the book website for download.
A Slide I Like
I’m updating a talk about machine learning for verbal autopsy analysis, and I thought I’d share a slide I like. I wonder what statisticians think about this view of the world:
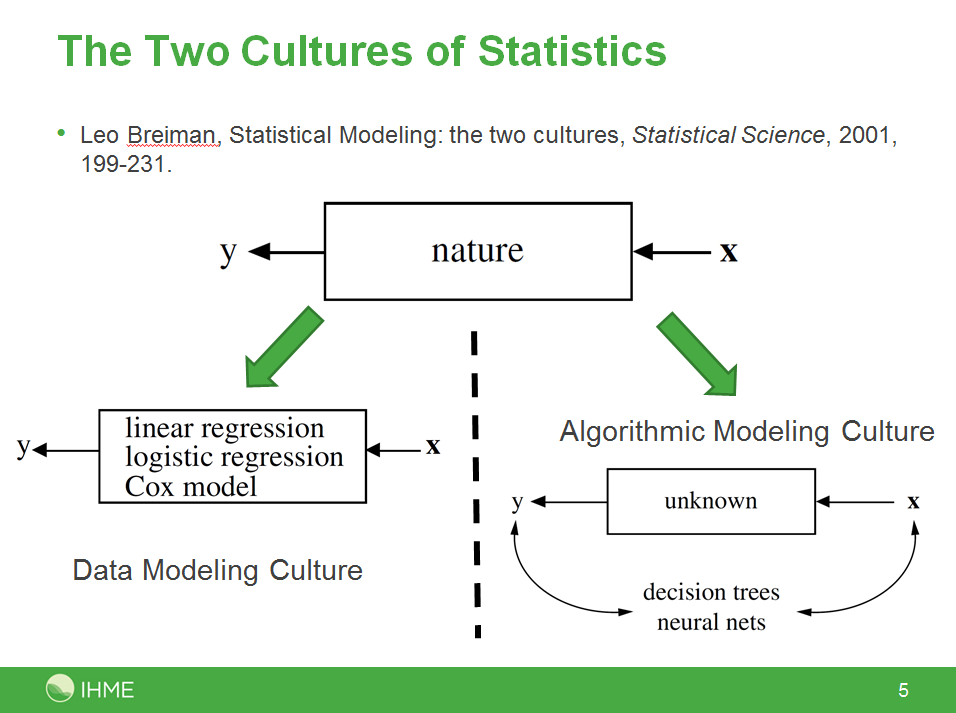
Comments Off on A Slide I Like
Filed under statistics
Schedule of a workshop I could use
Effective use of programming in scientific research, soon, far away, and already full.
Maybe we should do our own in Seattle.
Comments Off on Schedule of a workshop I could use
Filed under software engineering
A simple optimization problem I don’t know how to solve (from DCP)
Inspired by the recent 8F workshop, I’m trying to write up theory challenges arising from global health. And I’m trying to do it with less background research, because avoiding foolishness is a recipe for silence.
This is the what I called the “simplest open problem in DCP optimization” in a recent post about DCP (Disease Control Priorities), but with more reflection, I should temper that claim. I’m not sure it is the simplest. I’m not sure it is an open problem. And I’m pretty sure that if we solve it, the DCP optimizers will come back with something more complicated.
But it is a nice, clean problem to start with. I’m calling it “Fully Stochastic Knapsack”. It looks just like the plain, old knapsack problem:
The fully stochastic part is that everything that usually would be input data is now a probability distribution, and the parameters of the distribution are the input data.

This makes even deciding what to maximize a challenge. I was visiting the UW Industrial Engineering Dept yesterday, and Zelda Zabinsky pointed me to this nice INFORMS tutorial by Terry Rockafeller on “coherent approaches” to this.
Filed under combinatorial optimization, global health
MCMC in Python: A simple random effects model and its extensions
A nice example of using PyMC for multilevel (aka “Random Effects”) modeling came through on the PyMC mailing list a couple of weeks ago, and I’ve put it into a git repo so that I can play around with it a little, and collect up the feedback that the list generates.
Here is the situation:
Hi All,
New to this group and to PyMC (and mostly new to Python). In any case, I’m writing to ask for help in specifying a multilevel model (mixed model) for what I call partially clustered designs. An example of a partially clustered design is a 2-condition randomized psychotherapy study where subjects are randomly assigned to conditions. In condition 1, subjects are treated in small groups of say 8 people a piece. In the condition 2, usually a control, subjects are only assessed on the outcome (they don’t receive an intervention). Thus you have clustering in condition 1 but not condition 2.
The model for a 2-condition study looks like (just a single time point to keep things simpler):
where y_ij is the outcome for the ith person in cluster j (in most multilevel modeling software and in PROC MCMC in SAS, subjects in the unclustered condition are all in clusters of just 1 person), b_0 is the overall intercept, b_1 is the treatment effect, Tx is a dummy coded variable coded as 1 for the clustered condition and 0 for the unclustered condition, u_j is the random effect for cluster j, and e_ij is the residual error. The variance among clusters is \sigma^2_u and the residual term is \sigma^2_e (ideally you would estimate a unique residual by condition).Because u_j interacts with Tx, the random effect is only contributes to the clustered condition.
In my PyMC model, I expressed the model in matrix form – I find it easier to deal with especially for dealing with the cluster effects. Namely:
where X is an n x 2 design matrix for the overall intercept and intervention effect, B is a 1 x 2 matrix of regression coefficients, Z is an n x c design matrix for the cluster effects (where c is equal to the number of clusters in the clustered condition), and U is a c x 1 matrix of cluster effects. The way I’ve written the model below, I have R as an n x n diagonal matrix with \sigma^2_e on the diagonal and 0’s on the off-diagonal.All priors below are based on a model fit in PROC MCMC in SAS. I’m trying to replicate the analyses in PyMC so I don’t want to change the priors.
The data consist of 200 total subjects. 100 in the clustered condition and 100 in the unclustered. In the clustered condition there are 10 clusters of 10 people each. There is a single outcome variable.
I have 3 specific questions about the model:
- Given the description of the model, have I successfully specified the model? The results are quite similar to PROC MCMC, though the cluster variance (\sigma^2_u) differs more than I would expect due to Monte Carlo error. The differences make me wonder if I haven’t got it quite right in PyMC.
- Is there a better (or more efficient) way to set up the model? The model runs quickly but I am trying to learn Python and to get better at optimizing how to set up models (especially multilevel models).
- How can change my specification so that I can estimate unique residual variances for clustered and unclustered conditions? Right now I’ve estimated just a single residual variance. But I typically want separate estimates for the residual variances per intervention condition.


Here are my first responses:
1. This code worked for me without any modification. 🙂 Although when
I tried to run it twice in the same ipython session, it gave me
strange complaints. (for pymc version 2.1alpha, wall time 78s).
For the newest version in the git repo (pymc version 2.2grad,
commit ca77b7aa28c75f6d0e8172dd1f1c3f2cf7358135, wall time 75s) it
didn’t complain.
2. I find the data wrangling section of the model quite opaque. If
there is a difference between the PROC MCMC and PyMC results, this
is the first place I would look. I’ve been searching for the most
transparent ways to deal with data in Python, so I can share some
of my findings as applied to this block of code.
3. The model could probably be faster. This is the time for me to
recall the two cardinal rules of program optimization: 1) Don’t
Optimize, and 2) (for experts only) Don’t Optimize Yet.
That said, the biggest change to the time PyMC takes to run is in
the step methods. But adjusting this is a delicate operation.
More on this to follow.
4. Changing the specification is the true power of the PyMC approach,
and why this is worth the extra effort, since a random effects
model like yours is one line of STATA. So I’d like to write out
in detail how to change it. More on this to follow.
5. Indentation should be 4 spaces. Diverging from this inane detail
will make python people itchy.
Have a look in the revision history and the git repo README for more.
Good times. Here is my final note from the time I spent messing around:
Django and Rails have gotten a lot of mileage out of emphasizing
_convention_ in frequently performed tasks, and I think that PyMC
models could also benefit from this approach. I’m sure I can’t
develop our conventions myself, but I have changed all the file names
to move towards what I think we might want them to look like. Commit
linked here.
My analyses often have these basic parts: data, model, fitting code,
graphics code. Maybe your do, too.
p.s. Scott and I have started making an automatic model translator, to generate models like this from the kind of concise specification that users of R and STATA are familiar with. More news on that in a future post.
Filed under MCMC, statistics
DCP MIP
(This is a post that I started a long time ago (Aug 10, 2010), but hung on to because it is only half-baked. But based on the philosophy that avoiding foolishness is a recipe for silence, I’m sending it out into the world. Coming next: the simplest useful open problem in DCP optimization.)
Acronyms are like candy in Global Health, and Operations Research is full of them, too. This post is a place for me to collect information about software available for solving the Mixed Integer Programming (MIP) problem that the Disease Control Priorities (DCP) project is going to put together.
DCP is a massive effort to quantify the cost-effectiveness of hundreds of health interventions across tens of “health platforms” (big hospitals, small clinics, pharmacies, etc). The output of this large, coordinated effort will be (as far as I’m concerned) a collection of giant matrices, that say, for different subsets of interventions across different platforms, (1) the cost of setting up the interventions, (2) the cost of operating the interventions, (3) the health gain from the interventions. Undoubtedly, there will be some quantification of the uncertainty in each of these quantities. Also, there is something called platform improvement, which can be thought of as a special type of intervention that makes a bunch of other interventions more effective on a certain platform. And there are a number of side-constraints; some interventions come together on certain platforms, some interventions are mutually exclusive, etc.
Some unknowns: (how) will the uncertainty in the entries of these matrices be quantified? Are the intervention choices all “yes/no” or do you choose how much you want of some of them, i.e a non-negative continuous variable?
This is the optimization that mixed integer programming was born for (except for the uncertainty, which takes us into less charted waters). So how we are going to do it, in theory, is just the sort of thing my OR classes focused on when I was in grad school. We didn’t talk much about how to do it in practice. Some of the hard-working students who sat in the business school and actually solved large integer programs would mutter about CPLEX once in a while at parties, but I didn’t pay it much heed.
Heed I must now pay. So I am collecting up the available MIP solvers here, and (eventually) evaluating them for my DCP optimization task. Got suggestions? I would love to hear them.
Filed under combinatorial optimization, global health
Interesting Book about Open-Source Software
I learned about an interesting book today, The Architecture of Open Source Applications, edited by Amy Brown and Greg Wilson. The introduction caught my attention:
Architects look at thousands of buildings during their training, and study critiques of those buildings written by masters. In contrast, most software developers only ever get to know a handful of large programs well—usually programs they wrote themselves—and never study the great programs of history. As a result, they repeat one another’s mistakes rather than building on one another’s successes.
This book’s goal is to change that. In it, the authors of twenty-five open source applications explain how their software is structured, and why. What are each program’s major components? How do they interact? And what did their builders learn during their development? In answering these questions, the contributors to this book provide unique insights into how they think.
If you are a junior developer, and want to learn how your more experienced colleagues think, this book is the place to start. If you are an intermediate or senior developer, and want to see how your peers have solved hard design problems, this book can help you too.
There are chapters on several software packages that I’ve enjoyed using, and chapters on several scientific/data analysis tools, but nothing on the tools I’m using day to day. Still interesting. Let me know if there is a great chapter you come across, since I’m going to be too busy to read the whole thing in the near future.
Comments Off on Interesting Book about Open-Source Software
Filed under software engineering
Long day, but there are longer
I had a long day today, but it’s nothing compared to my brother-in-law. He just went to Greenland. The sun doesn’t set there for months! He’s got some great pictures from his trip. It’s not all pretty pictures, though. There’s a new volcanic ash cloud floating his way, which means serious delays on his lost luggage. He has a great internet connection there, so he’ll be able to see how many page views his blog is getting, so go take a look, maybe a lot of web traffic will distract him from the fact that he has only one pair of underwear in a 1000 mile radius.
Comments Off on Long day, but there are longer
Filed under general
Journal Culture
All fields have their quirks in publication style. Today I’m thinking about statistics, because I’ve been asked to explain something about survey weights to our post-bachelor’s fellows. There is a nice paper on the matter by Andrew Gelman, which starts strong, with first sentence “Survey weighting is a mess.” Start like that, and you’re sure to get a response from survey statisticians, who (at least I imagine) think of themselves as about as tidy as it comes.
The quirk in stats publications that I’m thinking of today is the Comment/Rejoinder format, wherein an article was published together with responses from several statisticians who don’t all agree with the article, and then a response from authors of the article. This is cool.
Unfortunately, Google scholar hasn’t kept up with this format, and searching for the paper title Struggles with Survey Weighting and Regression Modeling found me just one of the five comments. Project Euclid hasn’t kept up either, with only a tiny link from the article to the table of contents from the journal it appeared in. And thus I was forced to follow the obscure links in the pdf of the article to find the comprehensive list, which I’m putting here in case I need to find them all again sometime.
Statistical Science, Vol. 22, No. 2: Article/Comments/Rejoiner on Survey Weights
- Andrew Gelman, Struggles with Survey Weighting and Regression Modeling
- Robert M. Bell and Michael L. Cohen, Comment: Struggles with Survey Weighting and Regression Modeling
- F. Jay Breidt and Jean D. Opsomer, Comment: Struggles with Survey Weighting and Regression Modeling
- Roderick J. Little, Comment: Struggles with Survey Weighting and Regression Modeling
- Sharon L. Lohr, Comment: Struggles with Survey Weighting and Regression Modeling
- Danny Pfeffermann, Comment: Struggles with Survey Weighting and Regression Modeling
- Andrew Gelman, Rejoinder: Struggles with Survey Weighting and Regression Modeling
Comments Off on Journal Culture
Filed under statistics
Algorithms in the Field Workshop
Last week I attended the workshop Algorithms in the Field or “8F”, as its puzzling acronym turns out to be. David Eppstein published comprehensive notes on the talks on his blog:
I like to think that I’m doing “8F” in my global health job, and also some algorithms in the forest, algorithms in the desert, etc. But this workshop gave me a chance to think about the connection to Algorithms with a capitol “A”, the kind going on in the theory group of the ivory towered computer science department. I’ve been pretty successful at coming up with little challenges in global health where algorithmic thinking is useful (e.g. Doctors = Noise Machines), and I’m going to try to use the blog to throw more of these puzzles over the fence in the next few weeks. My barrier to doing this in the past has been the amount of background research I need to do to avoid sounding foolish. But my writing style was never suited to caution. Let’s see how it goes. I hope that even half-explained connections between Algorithms and global health will inspire some algorithmitician to fill in the details.
What I challenge myself to do more of is to go beyond the little puzzles, and synthesize something bigger to ask from algorithmists. What algorithmic innovation would really change how we’re doing things in Global Health? This is a domain where avoiding foolishness is even more of a recipe for silence. But I will try.
On my mind now: the computation time necessary to fit a model. 20 seconds, 20 minutes, or 20 hours is a really big difference. More on that thought to come.
Question to readers from Global Health Departments, what do you think capitol-A algorithms researchers can offer us?
Comments Off on Algorithms in the Field Workshop
Filed under global health, TCS
